In the vast and volatile world of Forex trading, where trillions of dollars change hands daily, having a reliable method to analyze price movements is crucial for success. Forex technical analysis is precisely that—a powerful methodology used by traders to forecast the future direction of currency pairs by examining historical price data and market statistics . Unlike fundamental analysis, which focuses on economic factors, technical analysis operates on the premise that all known market information is already reflected in the price, and that identifiable patterns tend to repeat themselves over time . This comprehensive guide will take you through the core principles, essential tools, and practical strategies of technical analysis, providing you with a foundational roadmap to navigate the Forex markets with greater confidence.
The Core Principles: The Trader’s Foundation
Technical analysis is built upon three universally accepted principles that form the bedrock of this approach to the markets.
- Market Action Discounts Everything: This is perhaps the most fundamental concept. It states that the current market price of a currency pair incorporates all known information, including economic data, political events, market sentiment, and even the collective fears and greed of all traders . Therefore, the technician believes that analyzing price action alone is sufficient, as the price itself tells the complete story of supply and demand.
- Prices Move in Trends: Technical analysts firmly believe that prices move in identifiable trends, which can be upward (bullish), downward (bearish), or sideways (ranging) . A core tenet is that a trend in motion is more likely to continue than to reverse. This principle leads to the common trader adage, “the trend is your friend,” and much of technical analysis is dedicated to identifying trends early and trading in their direction.
- History Repeats Itself: The repetitive nature of price movements is attributed to market psychology. Patterns that have occurred in the past are likely to occur again because they reflect consistent human reactions to similar market conditions, such as fear and greed . Chart patterns like head and shoulders or double tops have remained effective for decades because they graphically represent these recurring psychological states.
Essential Tools of the Trade
To put these principles into practice, traders utilize a diverse toolkit of charts, concepts, and indicators.
Chart Types: Your Window to the Market
- Line Charts: The simplest form, created by connecting closing prices over a period. They provide a clean view of the overall trend but lack detailed information .
- Bar Charts: Also known as OHLC (Open, High, Low, Close), these charts provide more data for each period, showing the opening and closing prices as well as the high and low range .
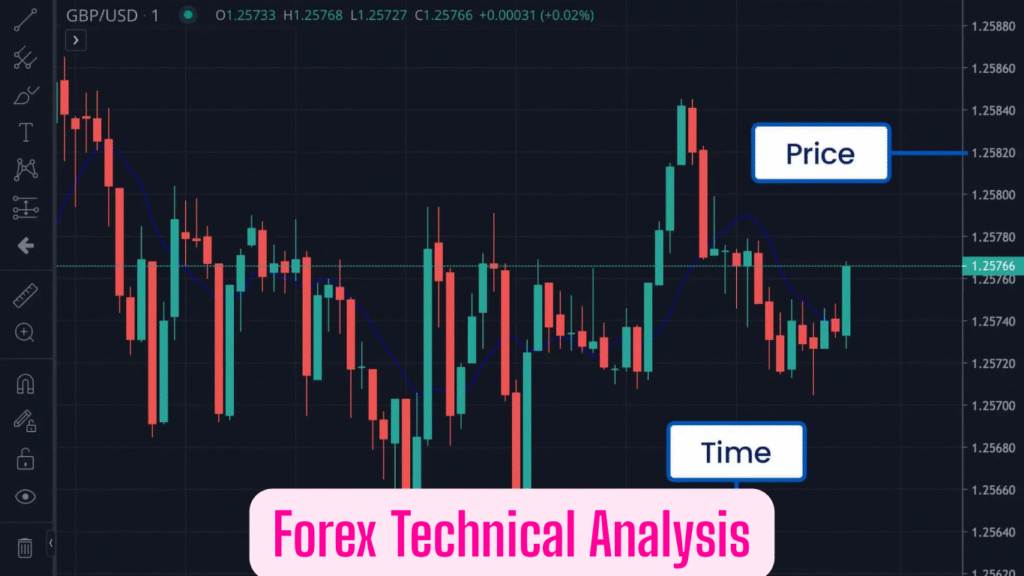
- Candlestick Charts: Similar to bar charts but visually more intuitive. The “body” of the candlestick shows the area between the open and close, while “wicks” represent the high and low. They are favored by most traders for their ease of reading market sentiment and identifying potential reversal patterns .
Key Concepts: The Building Blocks
- Support and Resistance: Support is a price level where buying interest is sufficiently strong to overcome selling pressure, causing a halt or reversal in a downtrend. Resistance is the opposite—a level where selling pressure overcomes buying interest, halting or reversing an uptrend . Identifying these levels is critical for determining entry, exit, and stop-loss points.
- Trends and Trendlines: An uptrend is characterized by a series of higher highs and higher lows, while a downtrend consists of lower highs and lower lows . Trendlines are straight lines drawn along these ascending troughs (support) or descending peaks (resistance) to visually represent and confirm the trend’s direction .
Popular Technical Indicators
Indicators are mathematical calculations based on price and/or volume that help traders make inferences about future price movements.
- Trend-Following Indicators:
- Moving Averages (MA): These smooth out price data to create a single flowing line, making it easier to identify the direction of the trend. Common types are the Simple Moving Average (SMA) and the Exponential Moving Average (EMA), which gives more weight to recent prices .
- MACD (Moving Average Convergence Divergence): This indicator shows the relationship between two moving averages and is used to spot changes in the strength, direction, momentum, and duration of a trend .
- Momentum Oscillators:
- RSI (Relative Strength Index): Measures the speed and change of price movements on a scale of 0 to 100. It is primarily used to identify overbought (typically above 70) and oversold (typically below 30) conditions .
- Stochastic Oscillator: Another momentum indicator that compares a closing price to its price range over a specific period, also used to signal potential overbought and oversold levels .
- Volatility Indicators:
Building a Trading Strategy: How to Combine Your Tools
The true power of technical analysis is unlocked not by using a single indicator, but by combining multiple tools to form a cohesive strategy. Relying on just one indicator can lead to false signals.
- Confirm with Different Indicator Types: A robust approach is to use a trend-following indicator to establish the overall market direction and a momentum oscillator to time your entry. For example, you might only consider buy signals when the price is above its 200-day EMA (indicating an uptrend) and the RSI dips into oversold territory and then crosses back above 30 (indicating a potential bounce) .
- Incorporate Multiple Timeframe Analysis: Before entering a trade, analyze the higher timeframes (e.g., daily or 4-hour charts) to understand the broader trend. Then, drill down to lower timeframes (e.g., 1-hour or 15-minute) to fine-tune your entry and exit points. This helps ensure you are trading in alignment with the dominant market momentum .
- Combine Indicators with Price Action: The most reliable signals often occur when indicator-based signals align with key price action levels. A buy signal from the MACD is far more convincing if it occurs at a well-established support level. Similarly, a breakout above a key resistance level with strong volume adds credibility to the move .
Advantages and Limitations: A Balanced View
Advantages
- Visual and Objective Framework: Charts provide a clear visual representation of price movement, and indicators are based on mathematical formulas, which can help remove emotion from trading decisions .
- Flexibility and Universality: Technical analysis can be applied to any market (forex, stocks, commodities) and across all timeframes, from scalping to long-term investing .
- Focus on Timing: It is exceptionally effective for identifying potential entry and exit points in the market, which is a primary challenge for traders .
Limitations
- Subjectivity: Two traders can look at the same chart and derive different interpretations of the support and resistance levels or patterns .
- Lagging Indicators: Many popular indicators are based on past price data, meaning they are inherently lagging and can sometimes generate signals after a move has already begun .
- Market Noise and False Signals: In choppy or ranging markets, indicators can produce numerous false signals, leading to potential losses. It is not a foolproof predictive science .
Conclusion
Forex technical analysis is an indispensable skill set for any trader looking to navigate the currency markets systematically. By understanding its core principles, mastering the essential tools like support/resistance and key indicators, and learning how to combine them into a disciplined strategy, you can significantly enhance your trading decisions. Remember, no single method guarantees success. Technical analysis is about assessing probabilities and managing risk. Continuous learning, practice on a demo account, and strict emotional discipline are the final, crucial components that transform theoretical knowledge into practical trading success.
Disclaimer
The information provided in this article is for educational and informational purposes only and should not be construed as financial, investment, or trading advice. Trading foreign exchange (forex) on margin carries a high level of risk and may not be suitable for all investors. There is a possibility that you may sustain a loss equal to or greater than your entire investment; therefore, you should not invest or risk money that you are not prepared to lose. Past performance of any trading system or methodology is not necessarily indicative of future results. You should be aware of all the risks associated with forex trading and seek advice from an independent financial advisor if you have any doubts.
FAQs
1. What is the main difference between technical and fundamental analysis in Forex?
The main difference lies in the data they use to make trading decisions. Technical analysis focuses solely on historical price charts, patterns, and mathematical indicators to forecast future price movements. It operates on the idea that all market information is already reflected in the price. Fundamental analysis, on the other hand, studies economic factors that influence a currency’s value, such as interest rates, GDP, employment data, and geopolitical events. Many successful traders use a combination of both to get a more complete market picture.
2. I’m a beginner. Which technical indicator should I start with?
For beginners, it’s best to start simple to avoid “analysis paralysis.” A highly recommended starting combination is a Moving Average (MA) like the 50 or 200-period to identify the overall trend direction, paired with the Relative Strength Index (RSI) to gauge momentum and identify potential overbought or oversold conditions. This two-tool system helps you answer two critical questions: “What is the trend?” and “Is the price potentially stretched and due for a pullback?”
3. Why do technical indicators sometimes give conflicting or false signals?
Conflicting and false signals are a common challenge. They occur for several reasons:
- Lagging Nature: Most indicators are based on past price data, so they can be slow to react to sudden market shifts caused by news events.
- Ranging Markets: Trend-following indicators (like Moving Averages) perform poorly in sideways or “ranging” markets, often generating repeated false buy and sell signals.
- Over-reliance: Using too many indicators from the same category (e.g., two momentum oscillators) can create conflicting data. The key is to combine different types of tools (e.g., one trend indicator and one momentum oscillator) for confirmation.
4. Can I become a profitable trader using only technical analysis?
Yes, it is possible, as many traders focus exclusively on technicals. However, long-term profitability depends on much more than just analysis. A successful trader combines technical analysis with a robust trading plan, strict risk management (including stop-loss orders and proper position sizing), and unwavering psychological discipline. Technical analysis provides the “map” for potential trades, but risk management and discipline are the vehicles that get you to your destination safely.
5. What is a common mistake beginners make when using technical analysis?
A very common mistake is using too many indicators at once, which leads to confusion and indecision. Loading a chart with a dozen different tools creates conflicting signals and “analysis paralysis,” where the trader is unable to pull the trigger. Another major mistake is ignoring the broader context by not performing multiple timeframe analysis. For example, a “buy” signal on a 5-minute chart is much less reliable if the overall daily chart is in a strong downtrend. The key is to keep your chart clean and always trade in the direction of the higher-timeframe trend.